The material is based on my workshop at Berkeley - Machine learning with scikit-learn. I convert it here so that there will be more explanation. Note that, the code is written using Python 3.6. It is better to read the slides I have first, which you can find it here. You can find the notebook on Qingkai's Github.
This week, we will talk how to use scikit-learn for classification problems. The idea is quite simple, we have different classes of objects, that we want to build a model that can tell which one belongs to which class. We will use the famous Iris dataset, you can check last week's blog to get more information about the dataset.
import numpy as np
import itertools
import matplotlib.pyplot as plt
from sklearn import svm, datasets
from sklearn.metrics import classification_report,confusion_matrix

plt.style.use('seaborn-poster')
%matplotlib inline
Load Iris data
Let's first load the data, since it has 4 different features, it is hard to visualize the data. We will first use only 2 features, and then we can plot them on a figure to see how the data looks like.
# import the iris data
iris = datasets.load_iris()

# let's just use two features, so that we can
# easily visualize them
X = iris.data[:, [0, 2]]
y = iris.target
target_names = iris.target_names
feature_names = iris.feature_names
# get the classes
n_class = len(set(y))
print('We have %d classes in the data'%(n_class))
We have 3 classes in the data# let's have a look of the data first
plt.figure(figsize = (10,8))
for i, c, s in (zip(range(n_class), ['b', 'g', 'r'], ['o', '^', '*'])):
ix = y == i
plt.scatter(X[:, 0][ix], X[:, 1][ix], color = c, marker = s, s = 60, label = target_names[i])
plt.legend(loc = 2, scatterpoints = 1)
plt.xlabel('Feature 1 - ' + feature_names[0])
plt.ylabel('Feature 2 - ' + feature_names[2])
plt.show()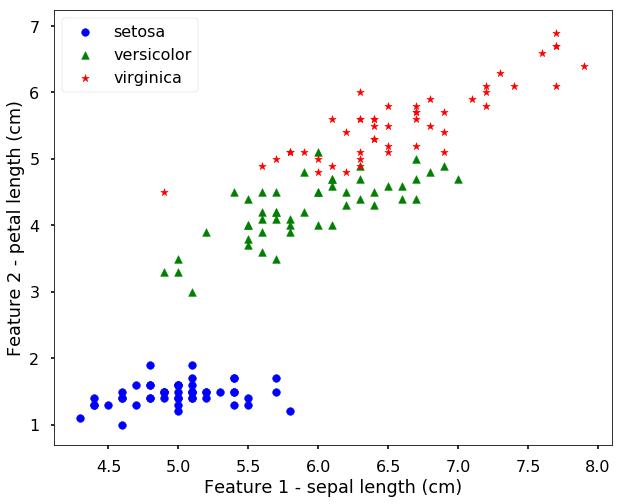
Train a SVM
We will first use a Support Vector Machine to classify the data. You can find the intuitive explanation in the previous blog - Support Vector Machine. Pay attention to the API we use, since they will be all similar across different classifiers in the scikit-learn. It has the work steps like this (a very typical workflow, but there will be more things when we use the model in real-world dataset, we will talk this in the future weeks. For now, just get ourselves familiar with the API):
- initialize the model
- train the classifier uses the 'fit' function.
- then you can estimate the incoming new data class use the 'predict' function
# Initialize SVM classifier
clf = svm.SVC(kernel='linear')

# Train the classifier with data
clf.fit(X,y)
SVC(C=1.0, cache_size=200, class_weight=None, coef0=0.0,
decision_function_shape=None, degree=3, gamma='auto', kernel='linear',
max_iter=-1, probability=False, random_state=None, shrinking=True,
tol=0.001, verbose=False)The training results
clf.predict(X)array([0, 0, 0, 0, 0, 0, 0, 0, 0, 0, 0, 0, 0, 0, 0, 0, 0, 0, 0, 0, 0, 0, 0,
0, 0, 0, 0, 0, 0, 0, 0, 0, 0, 0, 0, 0, 0, 0, 0, 0, 0, 0, 0, 0, 0, 0,
0, 0, 0, 0, 1, 1, 1, 1, 1, 1, 1, 1, 1, 1, 1, 1, 1, 1, 1, 1, 1, 1, 1,
1, 2, 1, 2, 1, 1, 1, 1, 2, 1, 1, 1, 1, 1, 2, 1, 1, 1, 1, 1, 1, 1, 1,
1, 1, 1, 1, 1, 1, 1, 1, 2, 2, 2, 2, 2, 2, 1, 2, 2, 2, 2, 2, 2, 2, 2,
2, 2, 2, 2, 2, 2, 2, 2, 2, 2, 2, 1, 2, 2, 2, 2, 2, 2, 2, 2, 2, 2, 2,
1, 2, 2, 2, 2, 2, 2, 2, 2, 2, 2, 2])
Let's view the performance on the training data, we will plot the confusion matrix. Also, we will plot the decision boundary, which will help us understand more of the capability of the classifier (since we only have two selected features, this makes us easier to view the decision boundary).
def plot_confusion_matrix(cm, classes,
                          normalize=False,
                          title='Confusion matrix',
                          cmap=plt.cm.Blues):
    """
    This function prints and plots the confusion matrix.
    Normalization can be applied by setting `normalize=True`.
    """
    fig = plt.figure(figsize=(10, 8))
    plt.imshow(cm, interpolation='nearest', cmap=cmap)
    plt.title(title)
    plt.colorbar()
    tick_marks = np.arange(len(classes))
    plt.xticks(tick_marks, classes, rotation=45)
    plt.yticks(tick_marks, classes)

    if normalize:
        cm = cm.astype('float') / cm.sum(axis=1)[:, np.newaxis]

    thresh = cm.max() / 2.
    for i, j in itertools.product(range(cm.shape[0]), range(cm.shape[1])):
        plt.text(j, i, cm[i, j],
                 horizontalalignment="center",
                 color="white" if cm[i, j] > thresh else "black")

    plt.tight_layout()
    plt.ylabel('True label')
    plt.xlabel('Predicted label')
    plt.show()

# Plotting decision regions
def plot_desicion_boundary(X, y, clf, title = None):
    '''
    Helper function to plot the decision boundary for the SVM
    '''

    x_min, x_max = X[:, 0].min() - 1, X[:, 0].max() + 1
    y_min, y_max = X[:, 1].min() - 1, X[:, 1].max() + 1
    xx, yy = np.meshgrid(np.arange(x_min, x_max, 0.01),
                         np.arange(y_min, y_max, 0.01))

    Z = clf.predict(np.c_[xx.ravel(), yy.ravel()])
    Z = Z.reshape(xx.shape)

    plt.figure(figsize = (10, 8))
    plt.contourf(xx, yy, Z, alpha=0.4)
    plt.scatter(X[:, 0], X[:, 1], c=y, alpha=0.8)

    if title is not None:
        plt.title(title)

    plt.xlabel('Feature 1')
    plt.ylabel('Feature 2')
    plt.show()
# predict results from the test data
predicted = clf.predict(X)
# plot the confusion matrix
cm = confusion_matrix(y,predicted)
plot_confusion_matrix(cm, classes=iris.target_names,
title='Confusion matrix, without normalization')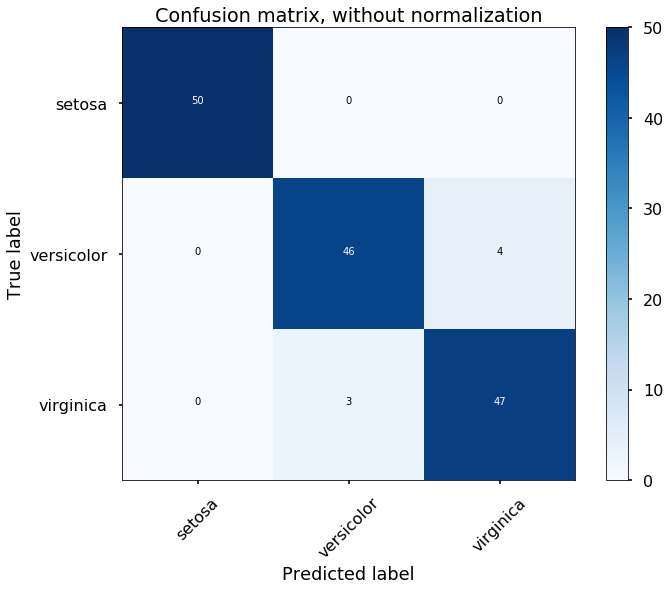
plot_desicion_boundary(X, y, clf)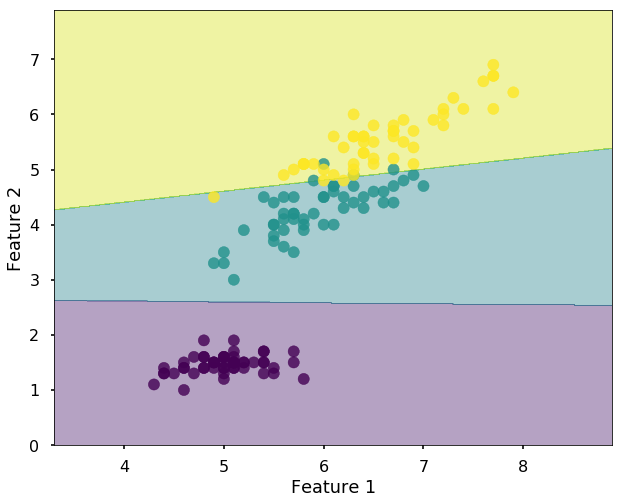
Using Artificial Neural Network
In this section, we will train an artificial neural network on the same data, and you will find the API is very similar, and you just need to understand some different arguments when you initialize the model. If you are not familiar with the artificial neural network, you can find my previous blog for an intuitive explanation.
from sklearn.neural_network import MLPClassifier

# Initialize ANN classifier

# create an ANN with two hidden layers, each with 10 neurons
hidden_layer_sizes = (10, 10)

# using a logistic activation function
activation = 'logistic'

mlp = MLPClassifier(hidden_layer_sizes= hidden_layer_sizes, activation=activation, \
                    max_iter = 2000, random_state=13)

# Train the classifier with the traning data
mlp.fit(X,y)

# predict results from the test data
predicted = mlp.predict(X)
# plot the confusion matrix
cm = confusion_matrix(y,predicted)
plot_confusion_matrix(cm, classes=iris.target_names,
title='Confusion matrix, without normalization')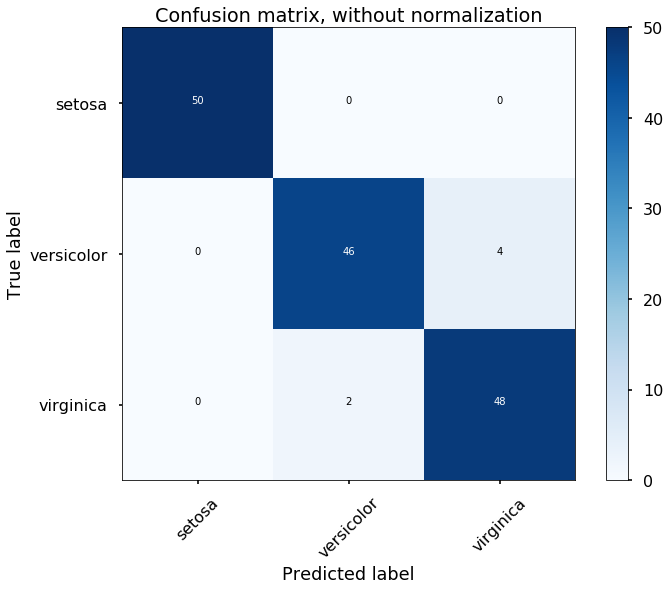
Good Blog
ReplyDeleteThanks For Sharing
Machine learning in Vijayawada
DR EMU WHO HELP PEOPLE IN ANY TYPE OF LOTTERY NUMBERS
DeleteIt is a very hard situation when playing the lottery and never won, or keep winning low fund not up to 100 bucks, i have been a victim of such a tough life, the biggest fund i have ever won was 100 bucks, and i have been playing lottery for almost 12 years now, things suddenly change the moment i came across a secret online, a testimony of a spell caster called dr emu, who help people in any type of lottery numbers, i was not easily convinced, but i decided to give try, now i am a proud lottery winner with the help of dr emu, i won $1,000.0000.00 and i am making this known to every one out there who have been trying all day to win the lottery, believe me this is the only way to win the lottery.
Dr Emu can also help you fix this issues
(1)Ex back.
(2)Herbal cure & Spiritual healing.
(3)You want to be promoted in your office.
(4)Pregnancy spell.
(5)Win a court case.
Contact him on email Emutemple@gmail.com
What's app +2347012841542
Website Https://emutemple.wordpress.com/
Https://web.facebook.com/Emu-Temple-104891335203341
Five weeks ago my boyfriend broke up with me. It all started when i went to summer camp i was trying to contact him but it was not going through. So when I came back from camp I saw him with a young lady kissing in his bed room, I was frustrated and it gave me a sleepless night. I thought he will come back to apologies but he didn't come for almost three week i was really hurt but i thank Dr.Azuka for all he did i met Dr.Azuka during my search at the internet i decided to contact him on his email dr.azukasolutionhome@gmail.com he brought my boyfriend back to me just within 48 hours i am really happy. What’s app contact : +44 7520 636249
ReplyDelete